Saliency Maps for Multi Head CNNs
TL;DR
Saliency maps are a versatile method to highlight areas used for predictions. However, they seem to perform better on models with simpler architectures.
Saliency maps are a great way to visualize which areas of an image had a significant impact on a model’s prediction. In a nutshell, saliency maps compute the derivative with respect to the image input rather than the model weights. This means that, instead of asking "How does a change in model weights affect the prediction?", it asks "How would a change in the image input affect the prediction?". As a result, areas that had a high impact on the prediction would be highlighted more than areas that had very little or no impact on the prediction.
Saliency maps do not perform equally across model architectures.
I tested the method for four different model architectures: mobilenet, inception, efficientnet and vgg. All models had an accuracy of 85% or higher on the test dataset with the exception of mobilenet, which only had an accuracy of 75%. Furthermore, all models correctly predicted the test image below.
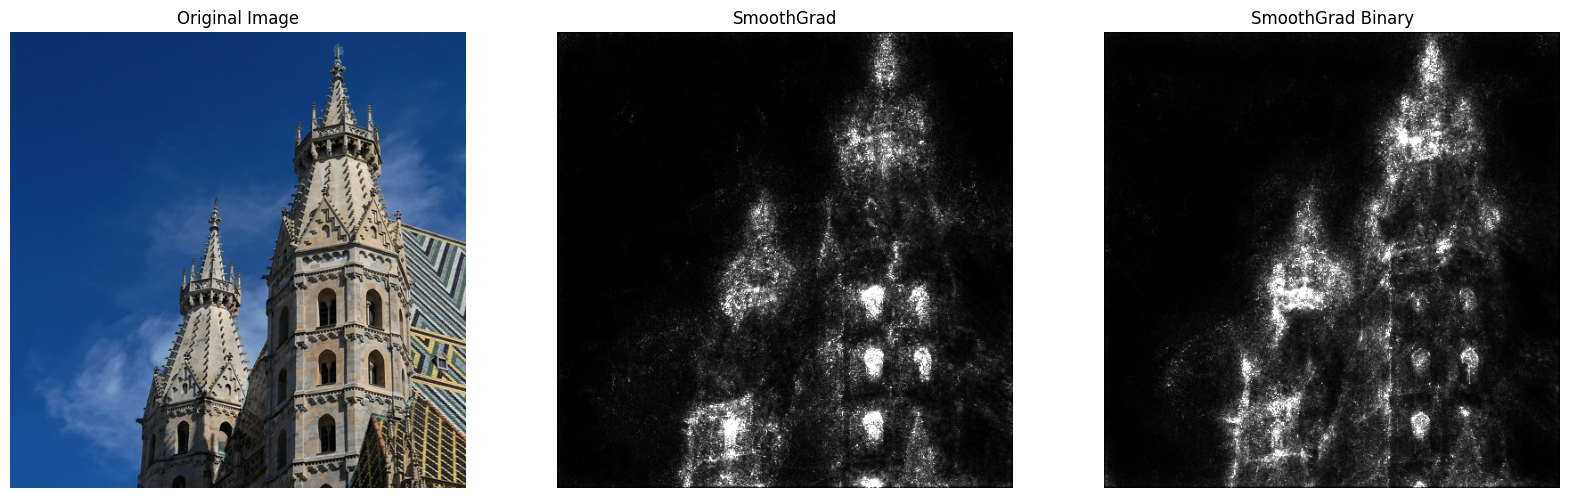
The task of the models was to determine the architectural style of a building (neoclassical, greek roman or gothic). The test image shows the gothic Stephansdom in Vienna from outside.
Efficientnet
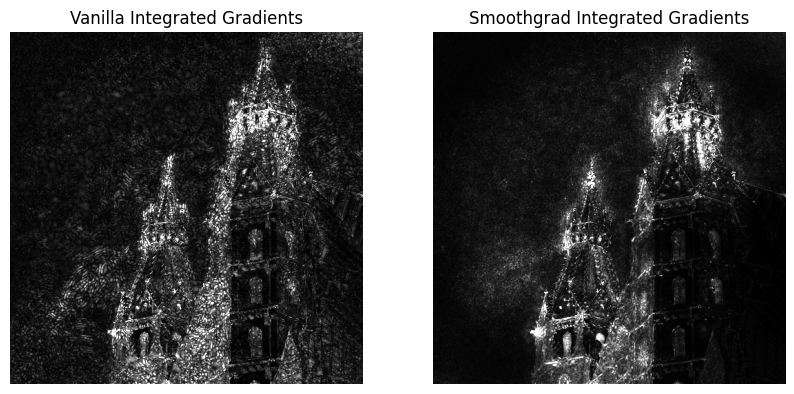
Not all methods worked well on efficientnet. Smoothgrad, Smoothgrad IG, Integrated Gradients did not lead to any useful results. Two methods, namely XRAI and Blur Integrated Gradients led to result that can be interpreted, however, other models were still easier to interpret.
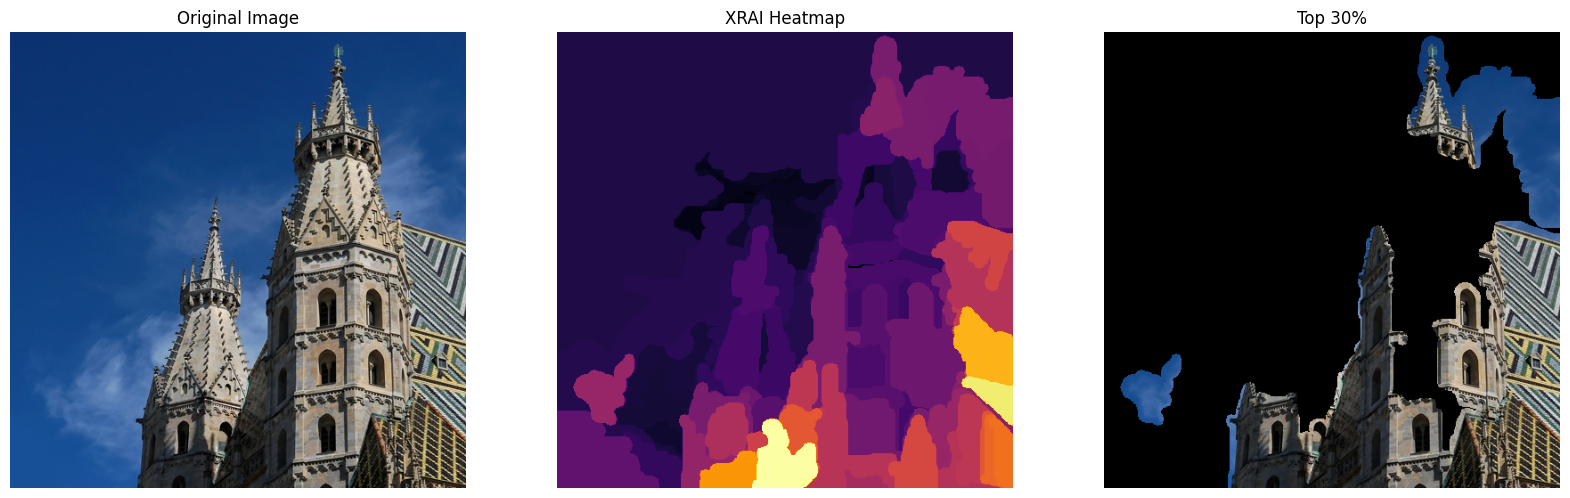
The XRAI Method led to fairly good results on Efficientnet
Inception
Inception worked well with all maps offered by the saliency library.
The Inception Architecture works well with saliency maps
Mobilenet
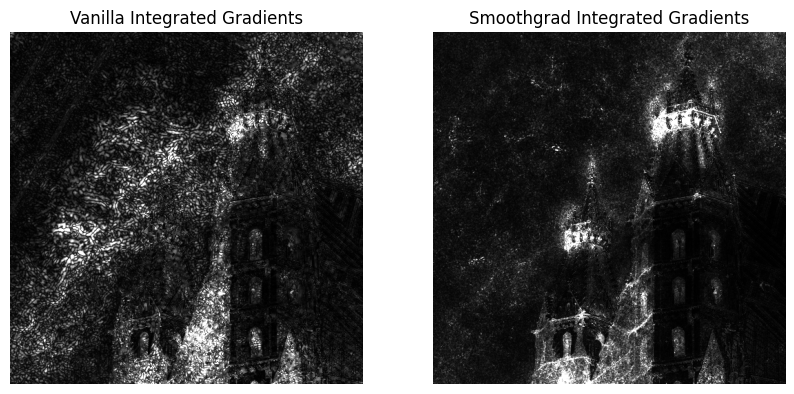
While Mobilenet did correctly classify the image, it led to saliency maps that were either not interpretable at all or incorrect. The image below shows that only the bottom right corner was used to infer the architectural style of the building, although the highlighted area does not contain a lot of information.
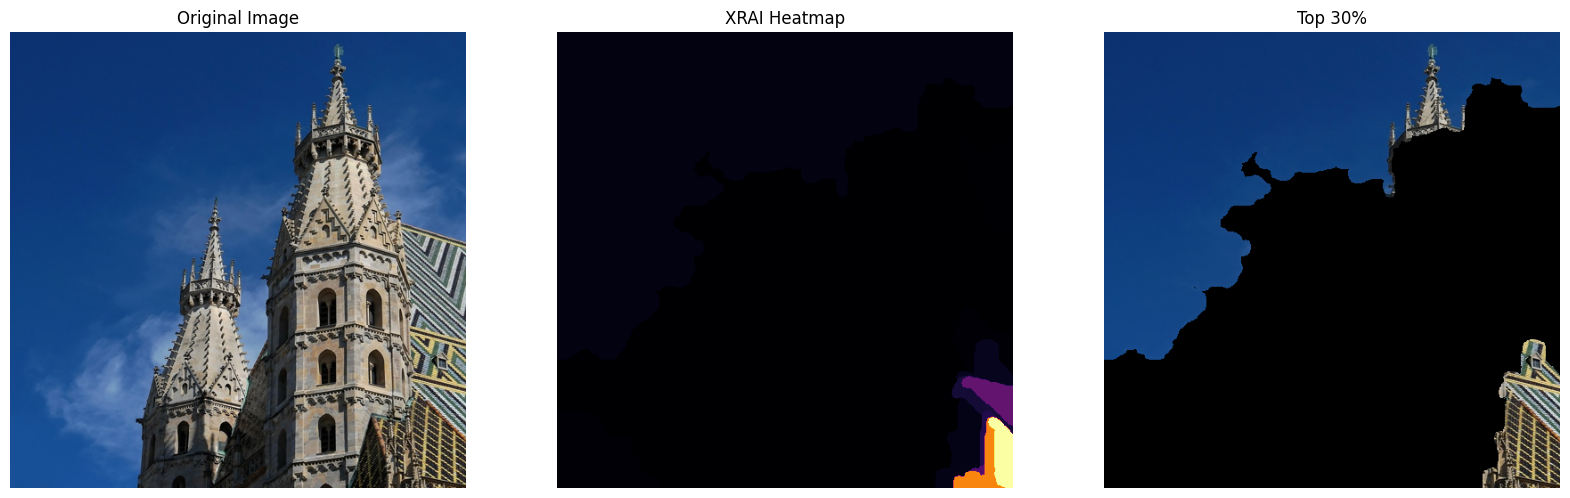
The saliency map only highlights the bottom right corner of the image
VGG
VGG also led to great results across all techniques. In order to further differentiate between the areas highlighted by the model, I extended the VGG model to feature a multi-head output. So not only does the model predict the architectural style, it also predicts the location from where the image was taken (either inside the building or outside).
VGG clearly differentiates between the background and the church
As seen below, the model placed higher emphasis on the contour of the church when predicting the perspective from which the image was taken. The windows and crenellations were most important for predicting the architectural style.
The center image highlights areas that were important to predict the architectural style whereas the image on the right highlights areas that were important to predict the perspective of the image.